Today, we look at some of the data for freshmen applying to the EECS and L&S CS majors at UC Berkeley. Interest in computer science has been growing quickly in the last few years, so a look at how those applying to college express this interest could be illuminating.
Contents
- The Admission Process
- Basic Admissions Statistics
- Comparison: EECS vs. L&S CS
- Gender Imbalance in the EECS and L&S CS Majors
- Summary
The Admission Process
For historical reasons, there are two separate majors sponsored by the department of Electrical Engineering and Computer Science (EECS) at Berkeley: the EECS major (offered in CoE, the College of Engineering) and the L&S CS major (offered in L&S, the College of Letters and Science). Because of the differences between colleges, the admission procedure differs for these two majors.
Freshmen applying to CoE are admitted directly to their major: each applicant is compared only to the applicant pool for their major. On the other hand, freshmen applying to L&S can indicate an intended major, but all L&S students are considered to be one pool of applicants for admissions readers, and enter without a major, declaring only after they have spent some time at Berkeley. (This can be nonobvious for students who are applying to Berkeley, unfortunately.)
So while the admission rate for L&S students is usually higher than that for CoE applicants, L&S students have an additional hurdle to overcome before declaring their major. Students interested in majoring in computer science are thus faced with a choice even before they come to Berkeley: applying to the EECS major (where they will have to hope they will be admitted to the second most selective major in CoE), or applying to L&S (where they may get in more easily, at the cost of having to do well enough in the prerequisite classes for the CS major).
Basic Admissions Statistics
Now that we’ve finished the infodump, let’s take a look at some data. I got this data from Cal Answers, which is a repository for UC Berkeley data available to students and staff. (There are a lot of interesting data other than admissions, too!) First, here are the basic admissions statistics for the last few years, excluding the most recent 2015-2016 admissions cycle (since the relevant data hasn’t been made available yet).
A couple of vocabulary terms to note, for those unfamiliar with the terminology: “SIR” is a Statement of Intent to Register, saying that the student intends to attend the college they submit their SIR to, while the “yield rate” is the percentage of admitted students who submit an SIR.
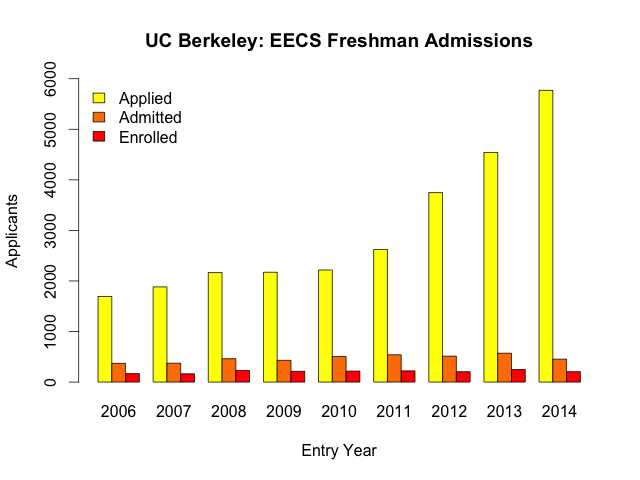
EECS
| Entry Year | Applied | Admitted | SIRed | Admit % | Yield % |
|---|---|---|---|---|---|
| 2006-2007 | 1693 | 370 | 168 | 21.85% | 45.41% |
| 2007-2008 | 1883 | 373 | 164 | 19.81% | 43.97% |
| 2008-2009 | 2166 | 463 | 231 | 21.38% | 49.89% |
| 2009-2010 | 2172 | 430 | 213 | 19.80% | 49.53% |
| 2010-2011 | 2217 | 505 | 217 | 22.78% | 42.97% |
| 2011-2012 | 2623 | 540 | 222 | 20.59% | 41.11% |
| 2012-2013 | 3748 | 513 | 206 | 13.69% | 40.16% |
| 2013-2014 | 4542 | 571 | 249 | 12.57% | 43.61% |
| 2014-2015 | 5770 | 453 | 206 | 7.85% | 45.47% |
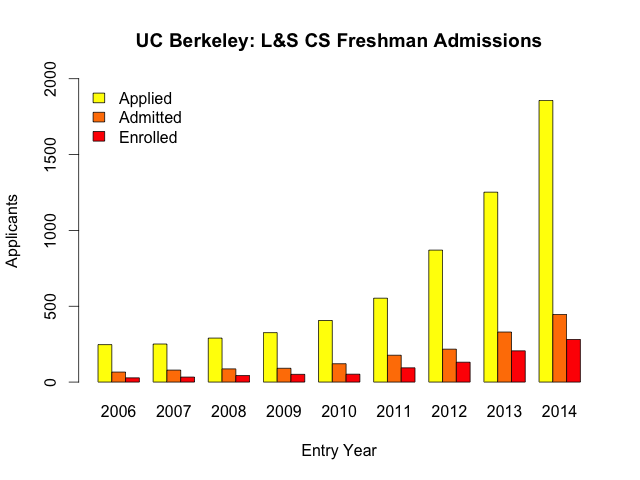
L&S CS
| Entry Year | Applied | Admitted | SIRed | Admit % | Yield % |
|---|---|---|---|---|---|
| 2006-2007 | 247 | 66 | 28 | 26.72% | 42.42% |
| 2007-2008 | 251 | 79 | 33 | 31.47% | 41.77% |
| 2008-2009 | 290 | 87 | 43 | 30.00% | 49.43% |
| 2009-2010 | 326 | 91 | 51 | 27.91% | 56.04% |
| 2010-2011 | 406 | 121 | 52 | 29.80% | 42.98% |
| 2011-2012 | 553 | 177 | 94 | 32.01% | 53.11% |
| 2012-2013 | 870 | 217 | 131 | 24.94% | 60.37% |
| 2013-2014 | 1252 | 330 | 206 | 26.36% | 62.42% |
| 2014-2015 | 1857 | 446 | 281 | 24.02% | 63.00% |
Comparison: EECS vs. L&S CS
Based off the basic information above, we compare the EECS and L&S CS data, aided by a number of plots. The rapid surge of interest in computer science is indeed reflected in our data, and there are a couple of surprising insights here.
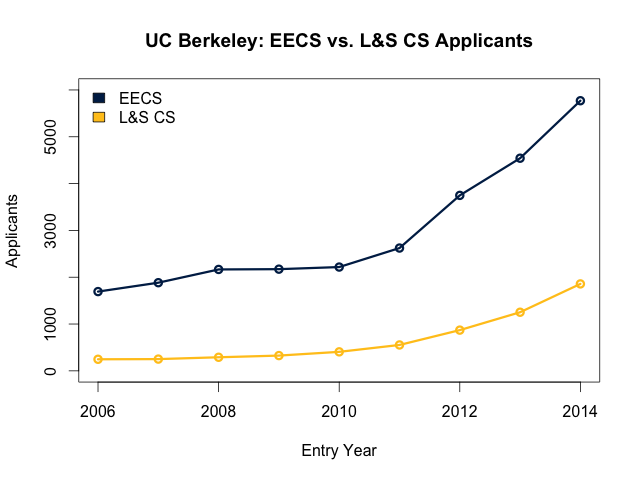
We can see that in the 2011-2014 period, the number of applicants took off quite rapidly for both majors after experiencing relatively slower growth in the years before 2011.
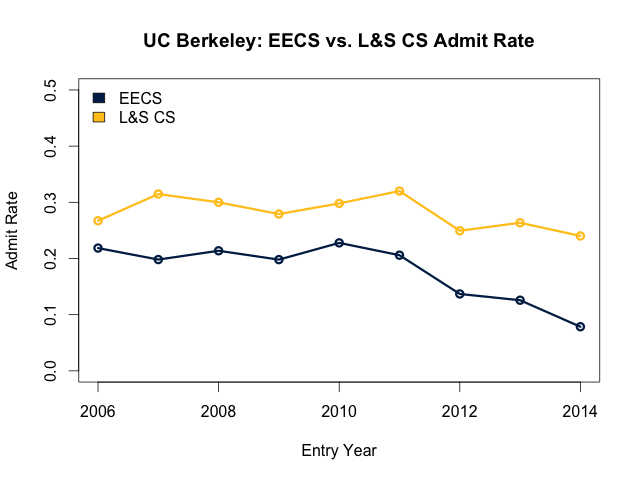
For the EECS major, since the number of spots in the major tends not to change too much from year to year, this meant that the admission rate tanked alongside the rise in interest, going from around 20% for the years before 2012 to less than 8% in the Fall 2014 cycle. However, the L&S CS major admission rate wasn’t affected as much, as those students are considered only as L&S students and thus don’t compete on the basis of intended major.
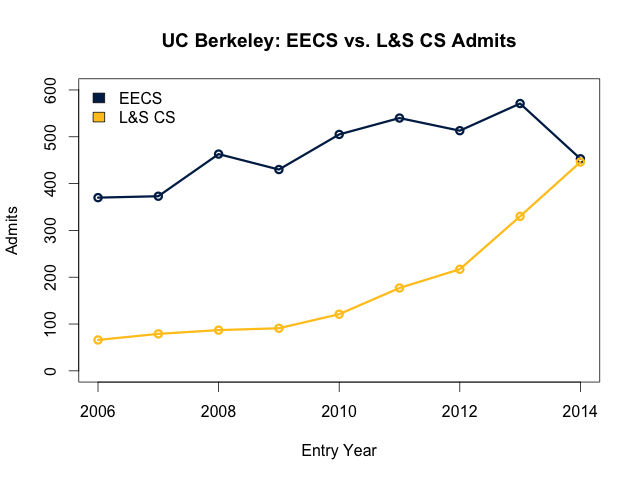
In fact, the number of admitted intended CS students increased quickly as well, reaching the number of admitted EECS students for the 2014-2015 cycle, despite the fact that many more applied to the EECS major than listed CS as their intended major in L&S. Coupled with the fact that the number of admits to L&S hadn’t increased drastically in these years, this is even more surprising.
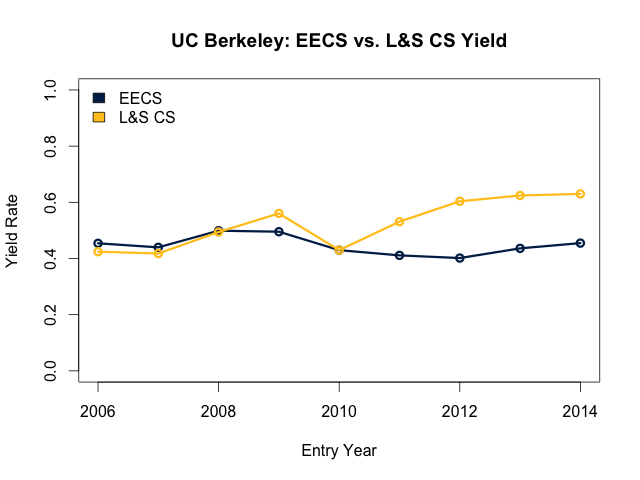
The increase in interest for the EECS major hasn’t seemed to affect the yield rate very much, though, as it merely fluctuated within the 40-50% range over the years. On the other hand, the intended CS students in L&S seemed to be more excited or optimistic than their counterparts headed to CoE, with their yield rate spiking in 2012. In the face of a GPA cap for declaring the major, this rise in commitment is surprising, though it’s hard to know whether these incoming freshmen were aware of the cap (which was initiated only in the past couple of years).
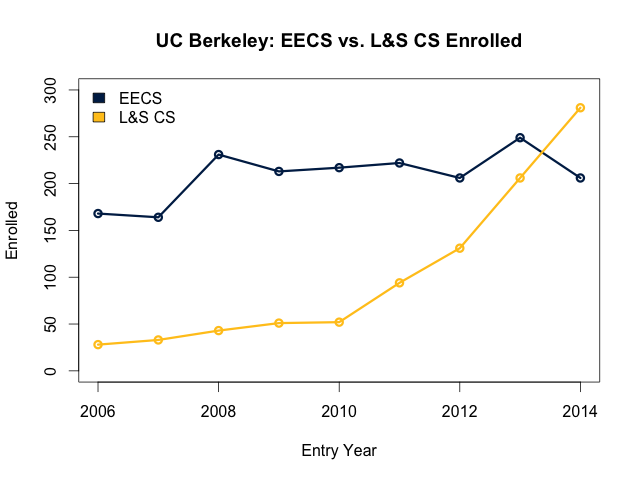
This eventually led to the number of intended L&S CS majors eclipsing the number of EECS majors for the 2014-2015 cycle when it came time to choose a college, a feat not seen for a long time (perhaps never before, though I haven’t looked at the data before 2006).
In the end, while the excitement about CS caused the admit rate in EECS to tank in order to keep the class size from growing too large, the number of L&S CS admits and the number of such students who ended up enrolling rose to new heights, despite the equivalent numbers for L&S as a whole being relatively stagnant. One hypothesis for why this could have happened is that the applicant pool of intended CS majors became stronger, perhaps as a result of stronger students redirecting their interest towards CS. Alas, it’s hard to tell whether this is the case, due to the lack of data for academic performance and the like on a major-by-major basis.
Gender Imbalance in the EECS and L&S CS Majors
While we’re at it, it wouldn’t be a bad idea to take a look at how interest and admission to the major can vary based on the applicants’ stated gender. Computer science, like many science and engineering fields, is commonly known to have a large gender imbalance. The data we present here, in the context of admissions to the EECS and L&S CS majors, certainly bear evidence of this fact. (Note that “Decline to State” is an option when asked for your gender.)
Data
Instead of showing the data directly in the post (which turns out to be cumbersome to browse when one has too many columns), I’ve opted to link to Google Docs spreadsheets.
Representation in Applicants and Admitted/Enrolled Students
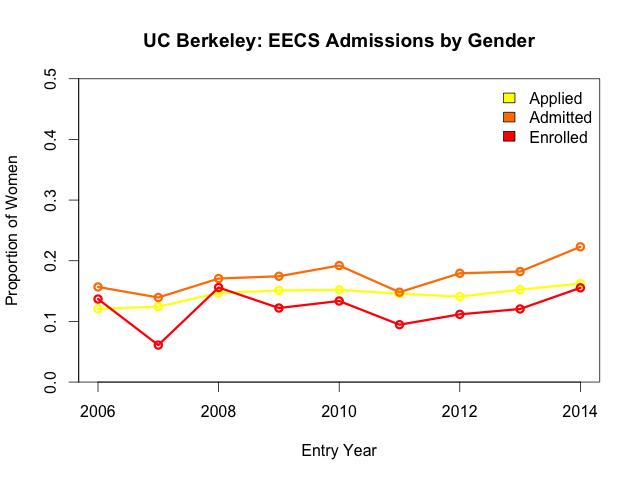
In the applicant pool for the EECS major, the gender ratio has been close to constant over the years we look at, with women making up about 14% of applicants (and men averaging around 86%). The admitted students have a somewhat higher proportion of women, at an average of 17%, but this drops down to around 12% of the enrolling class. Those who declined to state their gender make up a very small portion of the applicants and admitted students, and none of them decided to enroll at Berkeley.
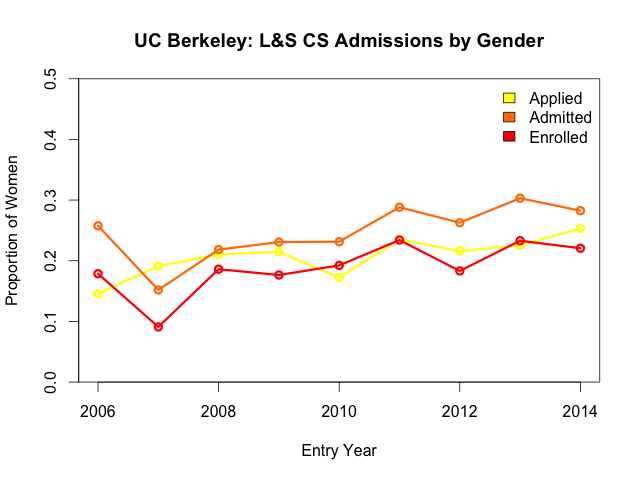
Of the intended L&S CS majors, women make up a bit more of the applicant pool than for the EECS major, around 21% (while men are about 79%). Similarly to the EECS applicants, this goes up to about 25% women for the admits, but then drops to an average of 19% of SIRs. Once again, those who selected “Decline to State” are very few in number, and none had decided to enroll in the end.
Admission and Yield Rates
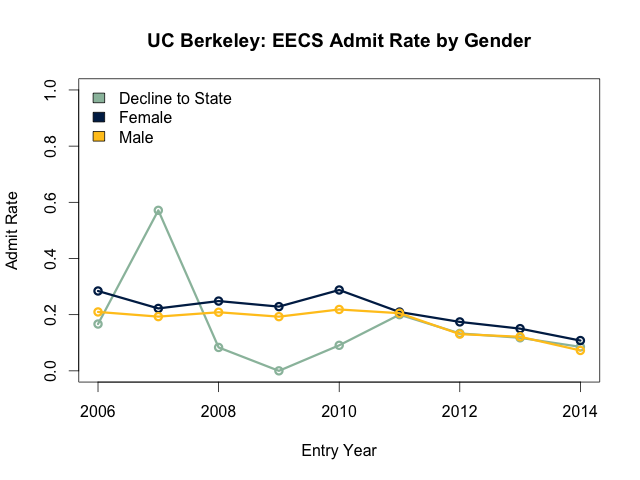
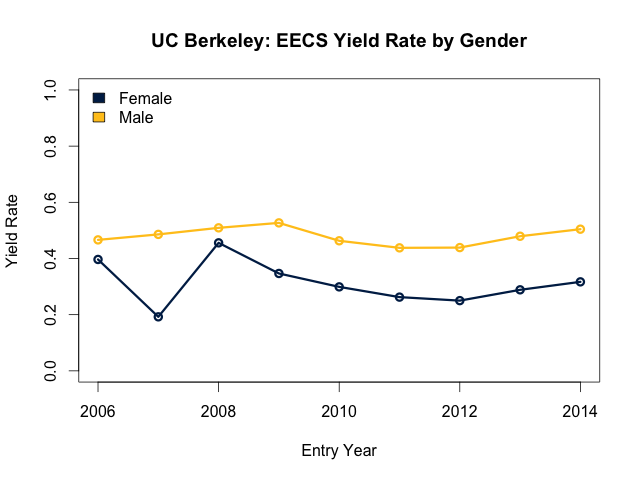
On average, women are admitted at a slightly higher rate than men to the EECS major. Unfortunately, their yield rate (averaging around 31%) is consistently significantly lower than that of the men (averaging around 48%).
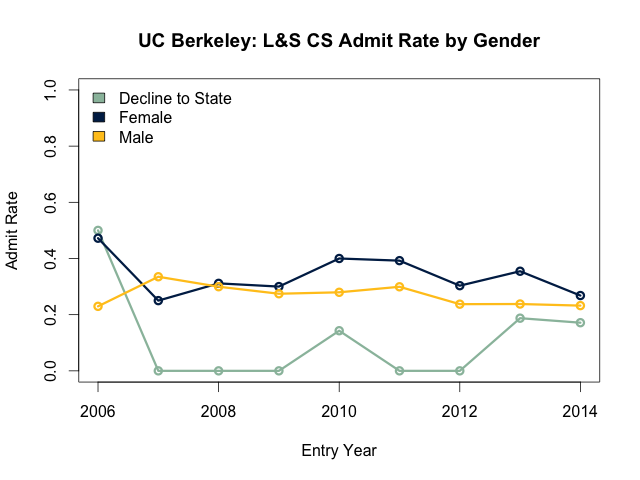
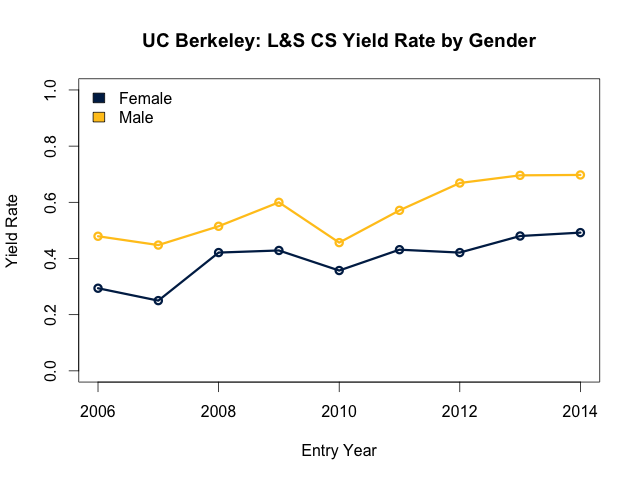
The admit and yield rates follow a similar pattern to those for the EECS major here: the admission rate for women is usually slightly better than that for men, while the yield rate for women is consistently lower than the men’s yield rate.
Note that this trend of women being admitted at a higher rate but then having a lower yield rate than men is not only restricted to the EECS and L&S CS majors. In the 2014-2015 admissions cycle, this phenomenon held for admissions to most CoE majors, to L&S, and to the university as a whole.
Summary
In our review of admissions data over the past few years for the EECS and L&S CS majors, we’ve found that there has indeed been a spike of interest in computer science, with application numbers showing this trend in a dramatic fashion.
While the selectivity of the EECS major has been significantly impacted by this wave of applicants, those who tried their hand at applying to L&S with an intended major of CS found a more favorable admission rate than the EECS applicants and demonstrated a higher yield than even the admitted EECS majors.
The gender inequality in the applicant pools for these majors, however, doesn’t seem to have been touched very much, if at all. Amid the surge in popularity of computer science, while more women have been applying to EECS and L&S CS, their representation has not especially increased, nor has their willingness to ultimately enroll (relative to the male applicants).
If you’re interested in looking at all the data, this spreadsheet has most of what you might be looking for, and more, including numbers on ethnicity that I haven’t had time to discuss here, but may appear in a future post. (There’s a lot of interesting data in Cal Answers!)
